
First-Time Visitors Over Time
Measure how your site attracts new audiences.
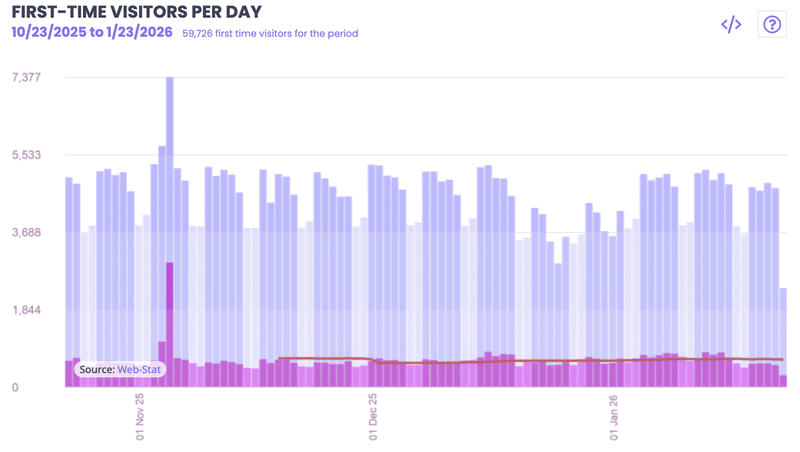
This graph shows the number of first-time visits to your site over a selected time period. You can change the period by selecting a different date range using the calendar icon at the top of the page.
A first-time visit is counted when a visitor accesses your site for the first time and has not been seen before. Visitors are identified using a browser cookie or an IP address.
If the same visitor returns to your site at a later time, those subsequent visits are not included in this report.The exact number of unique visitors can be seen at the bottom of each bar or by hovering your mouse over the bar.
When viewing daily reports over a period longer than 60 days, a red line appears on the graph. This line represents the 28-day rolling average of daily unique visitors. By smoothing out day-to-day variations, it helps reveal longer-term traffic trends.